The calculation of the FRAND royalty is an issue of great importance internationally, particularly in national rights especially in the USA, Europe and China, i.e. where SEP patent infringement litigation is frequently conducted.
In Europe in particular, and especially in Germany, many decisions deal with the legal aspects of the FRAND defence and the attendant circumstances in which it can be invoked.
Calculation basis
Although the calculation of the FRAND license has many open questions, the following formula seems to emerge progressively more in practice:
In principle, a license cap or total royalty stack is defined for a product with the license fee for the standards. This total royalty stack is usually an absolute amount to be paid in total to all SEP holders of the technology in question.
This total amount is then distributed among the various technology standards to be considered. These are, for example, 2G to 5G technologies, since mobile devices are generally backward compatible with all earlier technologies and thus include them. Of course, certain technologies structurally fall out of the compensation obligation, especially 2G for example, because essentially all patents have expired there. The same also applies to 3G technology at least in specific countries, as this technology is switched off gradually more.
It is important to note that the previous license caps for older technologies are not simply added together, but the total burden is spread across the technologies.
J. Birss[1] , for example, made a distribution of 2G:3G:4G in the ratio 10:20:70. In contrast, a court in Nanjing[2] considered a distribution of 2G:3G:4G in the ratio of 10:10:80 to be applicable.
Thus, for the calculation, the total load of the device is distributed among the different technologies, and in practice a great emphasis is placed on the last technology in each case. Moreover, the ratios may change over time as technologies disappear or the patent protection expires.
Furthermore, if the total license burden were, say, $10, then – just as an example – for the mere three standards under consideration here, the remuneration would be distributed 1:1:8 and 1:2:7, respectively, for 2G:3G:4G.
Subsequently, the practice assumes that all SEPs are basically of equal value. Of course, there is the argument that there are SEPs of very different value. There are detail improvements and there are fundamentals inventions. Nevertheless, because of the large number of SEPs in the standards, it is practically difficult to weight the SEPs. Another argument against weighting is that each SEP, regardless of its technical value, is capable of prohibiting the use of the standard. In this respect, its blocking effect is basically the same.
Therefore, an important question for the calculation of FRAND licenses is how the total number of SEPs of a given standard is calculated.
In practice the number of patent families that have been declared essential in certain standards are counted. Of course, there is the considerable problem of the so-called over declarations. It is in the interest of each enterprise to declare their patents filed during standardization as essential. Therefore, more patents are declared essential than there actually are SEPs. There have been many attempts to estimate and quantify the extent of the so-called over-declarations.
Nevertheless, given the mass of the declarations concerned, there is no reliable instrument for estimating the number of over-declarations so far. Often, an amount of about 20-70%[1], [2] of over-declarations is assumed.
The degree of over-declaration would be relatively irrelevant to the distribution, if it could be assumed that all declarants over-declared at roughly the same rate, i.e., relatively evenly.
If one uses the patent families declared as SEPs, one must differentiate these again according to their spatial validity. Only a few patents (patent families are always meant) are actually filed “worldwide”. As a rule, the patents are only validated in a few selected countries.
Here, of course, the question of how to evaluate the geographic scope arises. It is clear, of course, that a patent family that is only filed in a single country is of lesser importance and has far less value than a patent family that is valid in the essential and relevant countries.
Regarding this aspect of weighing the value of SEPs, there is usually little differentiation in the courts‘ decisions, although there are large differences between patent portfolios. From an economic perspective, it is however clear that these differences have serious implications.
Of course, the greatest economic significance lies in patents that are valid in the manufacturing countries. This is because such patents can be used to block manufacturing of the devices. These patents therefore go to the root of manufacturing.
The second greatest economic significance then lies in the number of patents that are valid for the major markets.
However, the analysis and counting of SEPs are even in the 21st century challenging. ETSI publishes a database comprising all patents which have been declared standard essential for different technologies. Based on this database and further sources, platforms such as IPlytics generate different queries and evaluations in order to generate management friendly summaries of the patent and market situation.
IPlytics published the „Fact finding study on patents declared to the 5G standard„[1] report in January 2020 and “Who leads the 5G patent race November 2021?” [2] report in November 2021 with the focus of both reports being on the 5G patent families registered with the IP5 (EPO, JPO, KIPO, CNIPA and USPTO) or only the EPO and USPTO. Others like e.g. IAM[3], [4], GreyB[5] or Clarivate[6] have published similar reports.
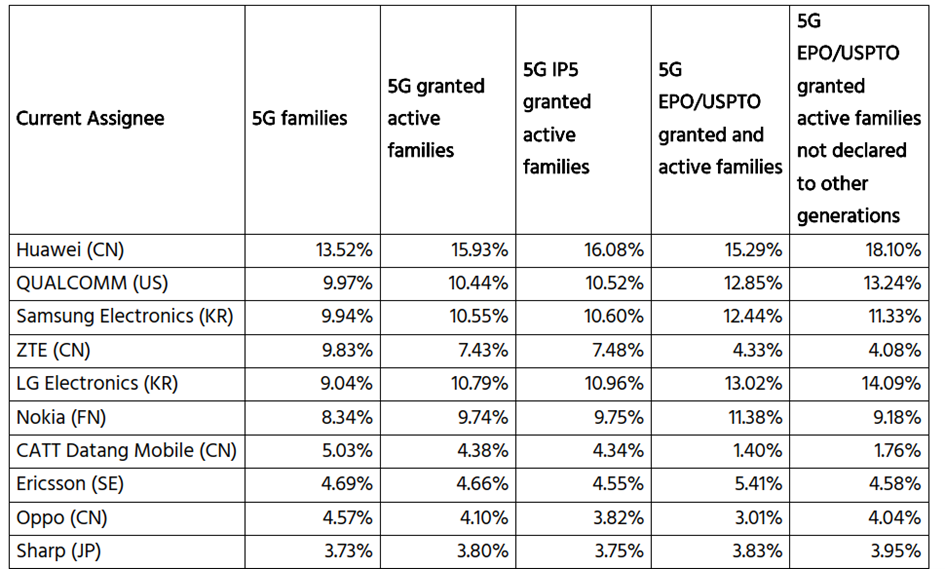
Figure 1: Top 10 enterprises in the IPlytics report “Who leads the 5G patent race November 2021?”, Page 3, November 2021
The USPTO published the „Patenting activity by companies developing 5G“[1] in February 2022 report, which discusses a snapshot of the SEP situation in May 2021. This snapshot was used for evaluating the technical contribution of enterprises to the 5G technology and therefore excludes all patents and patent applications which have been declared standard essential prior to 5G. The top seven enterprises of said snapshot in May 2021 and their corresponding “exclusively” 5G SEP families, which do have at least one active patent application or patent with the EPO, JPO and USPTO are shown in the following figure:
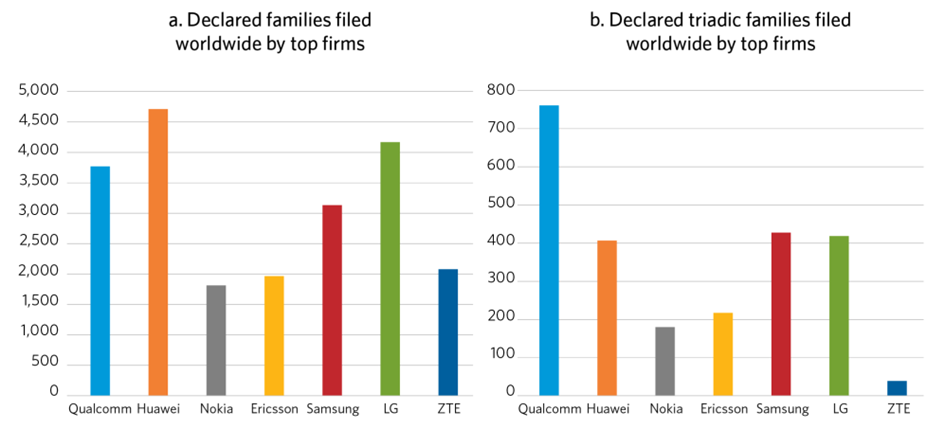
Figure 2: Top 7 enterprises in the USPTO report “Patenting activity by companies developing 5G”, page 5, February 2022.
In summary the above-mentioned reports use different methodologies when evaluating the situation of 5G SEPs for different regions, which makes it difficult to compare the different results.
USPTO’s “Patenting activity by companies developing 5G” report (“USPTO report” in the following) used the efficient approach of focussing on patent families which have simultaneously 5G granted family members at the three main patent offices. In the USPTO report EPO, JPO and USPTO have been chosen as the main patent offices. Contrary to this, IPlytics based the analysis in its most recent paper “The Year 2021 in Revue – SEP cases in Europe and Beyond“[1] published December 2021 on patent families where at least one patent has been granted at the IP5 offices (US, EP, CN, KR, JP).
As IPlytics states in this paper:
“…When considering the SEP holders that have self-declared at least 10 patent families over the past 10 years, the number of unique companies (considering only the highest parent of larger corporate groups) has risen from 99 in 2010 to 261 in 2021 (by factor 2.6x). The uptick in the number of new SEP holders is largely driven by market entrants from China, Taiwan and South Korea, which develop smartphones, network devices, computer chips, semiconductors and audio and video technology…”
Said development of new standards and new dynamics in the global market led to the questions whether the triadic approach suggested by the USPTO’s report “Patenting activity by companies developing 5G” (“USPTO report” in the following) reflects the current situation accurately.
The triadic approach of the USPTO report is based on the paper “Using Patent counts for cross-country comparisons of technology output” by Dernis et. al.[1] published in 2001. Said paper introduces the methodological choice that when evaluating a technology by the patent counts, the three patent offices, the EPO, JPO and USPTO should be taken into consideration.
In 2001 the EPO, JPO and USPTO seemed to be obvious choices, however the situation more than twenty years later is a lot different, since the markets and the global patent activities significantly changed.
Due to the increasing globalization and the ongoing rise of new economic powers the level of importance of different markets changed. As can be seen in the following chart, the turnover of mobile devices in billion € by region, the importance of the Chinese market increased in the last few years and is going to keep increasing. In particular, the situation is now completely different to 2001 where China did not play such an important role for the smartphone market.
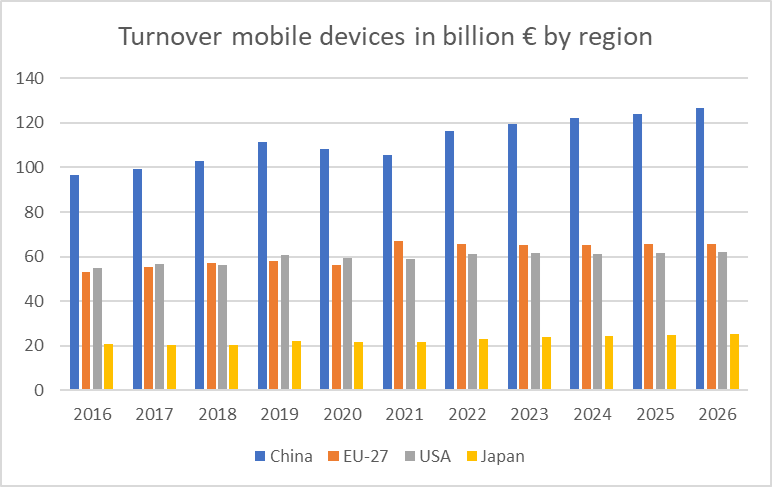
Figure 3: Development of the turnover for mobile devices (Source: Statista March, 2022, ”Outlook: mobile devices”)
A similar change can be observed in the global patent activities which have been analysed based on the IPlytics database and are shown in the following graph.
Said graph, shows that the patent activities before the different patent offices changed significantly during the development of the different technology generations 3G, 4G and 5G.
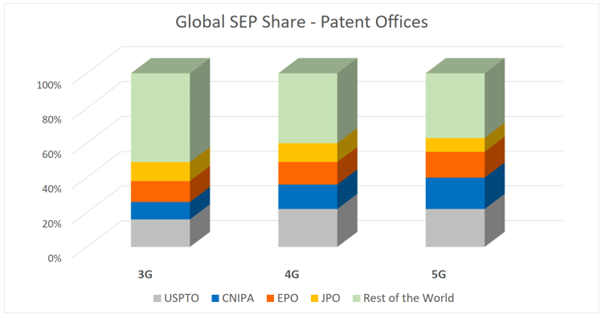
Figure 4: Patent filings at the different patent offices for 3G, 4G and 5G technologies (IPlytics database)
In the 3G technology generation, the top three filing offices have been the USPTO, the EPO and the JPO. Together they were responsible for 39 % of the 3G patent families. However, this changed for 4G, and in particular for 5G technology generations.
Currently, the top three filing offices for 5G have been the USPTO, the CNIPA and the EPO. The USPTO, the CNIPA and the EPO are now responsible for 55% of all 5G patent families. This means that the top three patent offices gained more weight for the 5G technology than they had for the 3G technology.
In parallel, the absolute number of patent families has also grown drastically. According to the IPlytics database only 39,015 SEPs have been filed for 3G. For 4G already 146,687 SEPs have been filed, and for 5G almost 200,000 patents and patent applications have been declared essential until December 31, 2021.
Based on the IPlytics database, the top-10 market participants, holding the most patent families in the 5G technology generation have been identified. The period under consideration extends up to the „declaration date“ of December 31, 2021. IPlytics cites the following enterprises and patent family numbers directed to 5G SEPs:
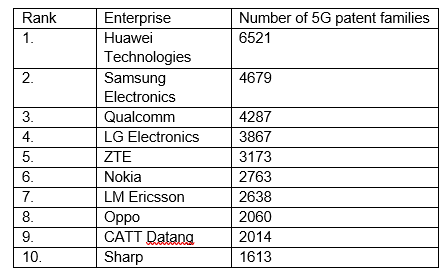
Figure 5: Enterprises ranked in the order of the number of patent family directed to 5G SEPs (Source: IPlytics database, data compiled October 2022)
As can be derived from the above top-10 list, four enterprises have their headquarters in China, wherein only 1 top-10 enterprise is located in Japan.
Based on the change in patent activities before the different patent offices and the locations of the top-10 enterprises, we conclude that, if the triadic approach is used it should be directed to the USPTO, CNIPA and EPO patent offices, because these are the most relevant patent offices for 5G SEPs as shown above. Additionally, the major markets for smartphones are now China, Europe and US.
Generally, the triadic approach based on the USPTO, CNIPA and EPO seem to provide a more reasonable assessment of the regional coverage of a granted SEP than IPlytics’ IP5 approach, as it reflects the status of the patent family in the major markets. Contrary to that, IPlytics’ IP5 approach provides a more specific regional coverage but less information on the status of the respective patent family.
Besides the question, whether a triadic approach based on USPTO, CNIPA and EPO or IPlytics IP5 approach is the better approach for assessing the value of a SEP patent family, it also needs to be discussed to what kind of patent families such an analysis has to be limited.
The USPTO report is directed to SEPs which have only been declared for 5G and not for prior technology generations, i.e., 4G or others. This approach seems to bear risks when evaluating the SEPs, because for example a SEP which is directed to handover protocols, would always be declared for 4G and 5G. Furthermore, a SEP which has been declared as standard essential for 4G can also be used for bringing forward claims, when it is later declared for 5G.
Therefore, we are of the opinion that 5G SEPs which have also been declared for other technology generations should not be excluded, since they can have an effect on the 5G market.
Results
Based on these findings we have chosen a “triadic” approach dependent on the USPTO, CNIPA and EPO, and considered 5G patent families which have been declared essential for other technologies as well. We considered only patent families which have been declared essential until 31.12.2021. Based on the IPlytics database we brought together the numbers of 5G patent families[1] of the top 10 companies identified in the IPlytics report.
In the graph below, the numbers of the 5G patent families which have simultaneously active members, i.e., patent applications and patents, with the USPTO as well as at the CNIPA and the EPO are shown in blue. The 5G patent families, which have simultaneously active patents with the USPTO as well as at the CNIPA and the EPO are shown in orange.
[1] IPlytics offers two different query options. The first query option allows filtering the SEPs by technology generation, which narrows down the SEPs by their technology generation, i.e. 5G, for the respective enterprise. This query was used to determine a first data set of SEPs, which are directed to 5G. This includes SEPs which have been redeclared, i.e. from 4G to 5G, as discussed above.
The first data set contains, for each SEP, a „Unique Priority Number“ which was used to determine all family members in a second query which are associated with the respective „Unique Priority Number“.
Significant deviations in the numbers of SEP families were observed depending on whether the first data set (technology generation) or the second data set (extended by family) was used to count the SEP families. Thus, the results of the above discussed IPlytics and USPTO reports seem to be associated with considerable uncertainties as well.
For the following considerations the second data set has been used. This is because several samples of SEP families have been investigated and the second data set seems to reproduce the real situation of SEPs better than the first data set.
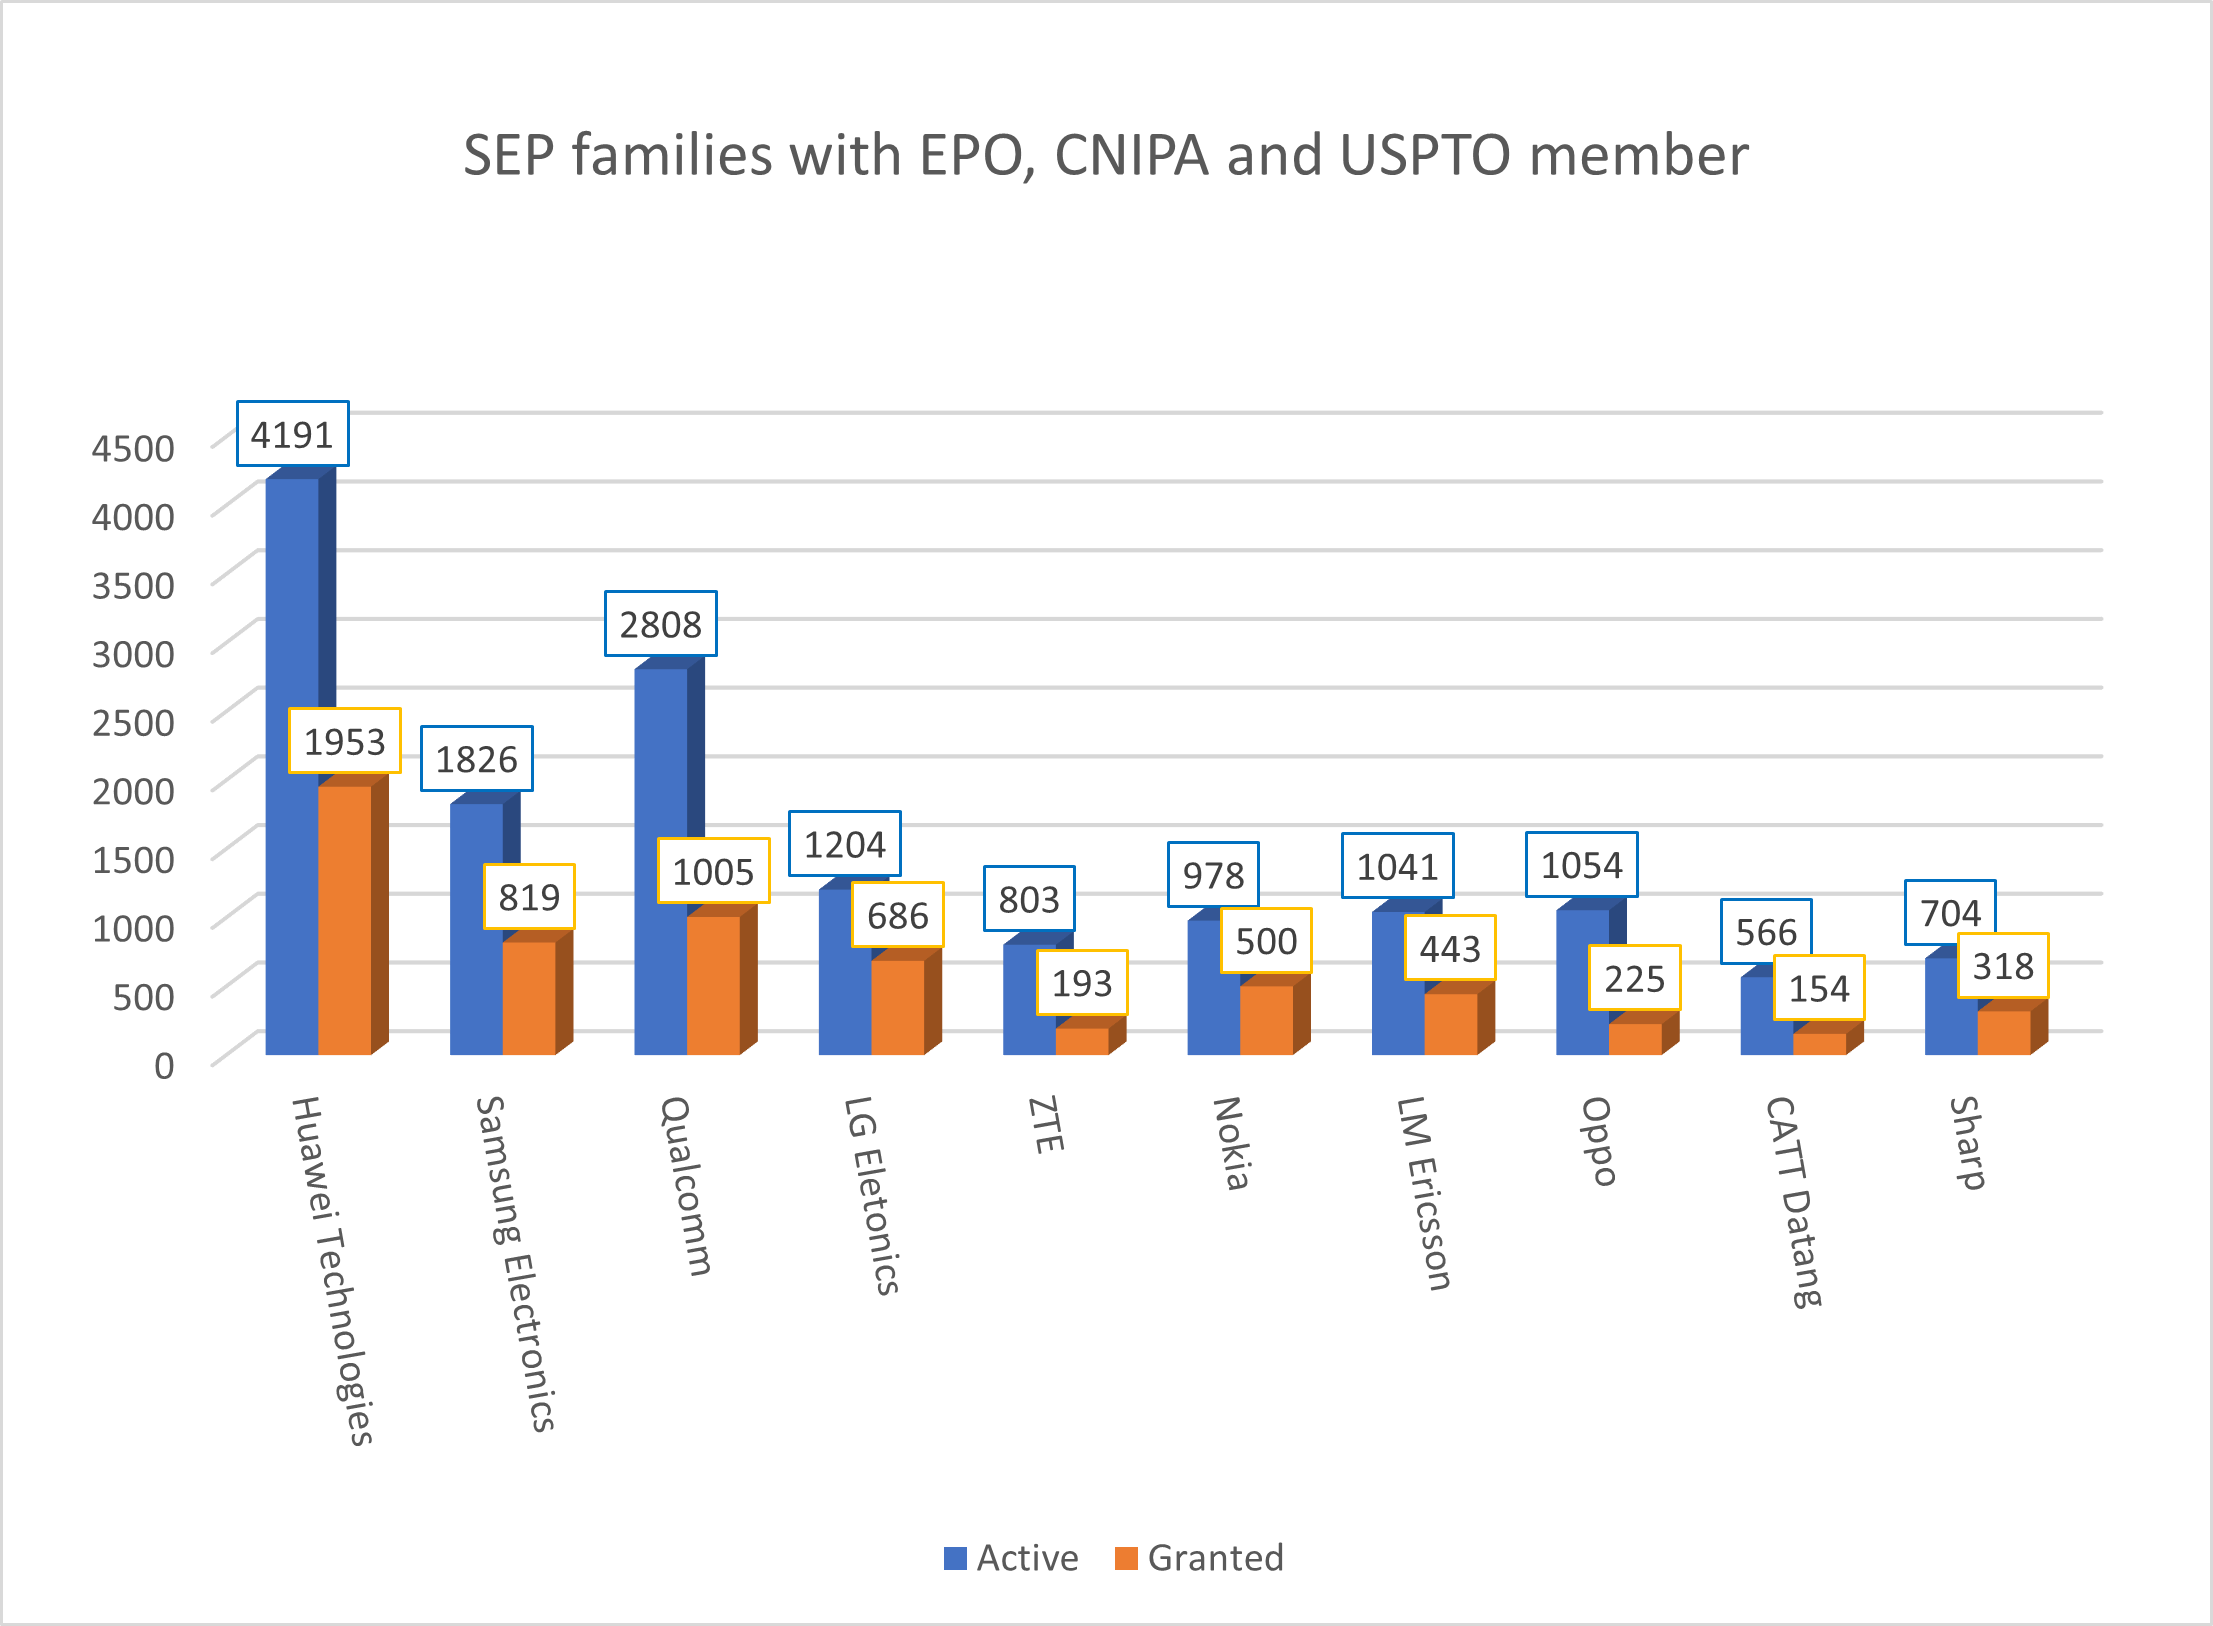
Figure 6: Enterprises and the number of patent family directed to 5G SEPs having active members (blue) and granted members (orange) at the CNIPA as well as at the EPO and the USPTO (Source: IPlytics database, data compiled October 2022)
This query was used to determine a first data set of SEPs, which are directed to 5G. This includes SEPs which have been redeclared, i.e. from 4G to 5G, as discussed above.
The first data set contains, for each SEP, a „Unique Priority Number“ which was used to determine all family members in a second query which are associated with the respective „Unique Priority Number“.
Significant deviations in the numbers of SEP families were observed depending on whether the first data set (technology generation) or the second data set (extended by family) was used to count the SEP families. Thus, the results of the above discussed IPlytics and USPTO reports seem to be associated with considerable uncertainties as well.
For the following considerations the second data set has been used. This is because several samples of SEP families have been investigated and the second data set seems to reproduce the real situation of SEPs better than the first data set.
When comparing the results of IPlytics’ evaluation with the above results, one can notice that assignees with a stronger local focus on 1 of the 5 patent offices (CNIPA , EPO, JPO, KPO and USPTO) are ranked higher in the IPlytics IP5 analysis, than in the triadic approach based on CNIPA , EPO and USPTO.
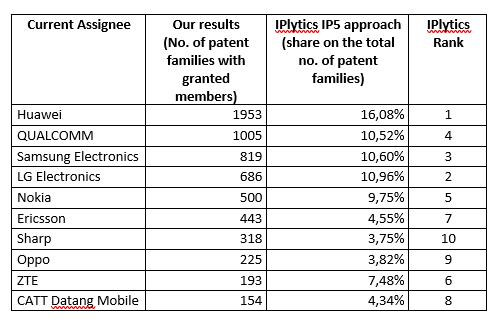
Figure 7: Enterprises and the number of patent family directed to 5G SEPs having granted members at the CNIPA as well as at the EPO and the USPTO (Source: IPlytics database, data compiled October 2022
Thus, the IP5 approach of IPlytics seems to overvalue the real relevance of their patent portfolio, if one considers the regional spread of the granted patents per family. This effect can be seen in one or the other directions also for other assignees.
In this context, Clarivate’s analysis[1] seems to be interesting. As shown in the below graph, Clarivate refers for its 5G analysis obviously to patent families filed at the China National Intellectual Property Administration, the US Patent and Trademark Office and the European Patent Office, i.e. the patent offices of the above-mentioned main markets for 5G. According to this analysis, most 5G patent families are filed at the CNIPA, followed by the USPTO and the EPO. The biggest share of 5G patent families at all three patent offices is held by Huawei, followed by Qualcomm and Samsung. This result is very similar to our own findings based on IPlytics database.
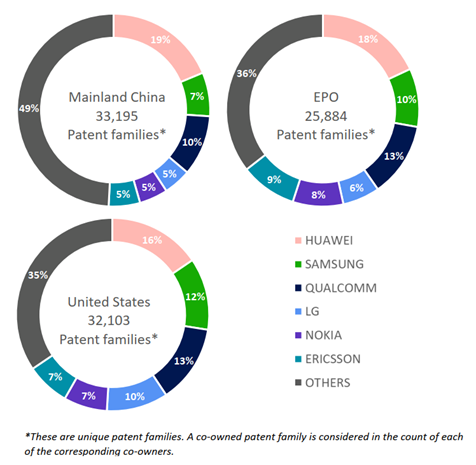
Figure 8: 5G patent families owned by top six companies in global leading markets (Source: Demystifying the 5G standard essential patent landscape: Phase 3)
According to this analysis, most 5G patent families are filed at the CNIPA, followed by the USPTO and the EPO. The biggest share of 5G patent families at all three patent offices are held by Huawei, followed by Qualcomm and Samsung. This result is very similar to our own findings based on the IPlytics database shown in Figure 6.
Summary
It seems that a triadic approach based on the present top three filing offices, for 5G patents offers one way for estimating not only the relevant spread of a patent family, but also the value and size of the relevant patent portfolio.
However, in this context it has to be considered that from technology-to-technology different patent offices will become relevant. For the mobile telecommunication industry it could be observed that from 3G to 5G the top three filing offices changed from EPO, JPO and USPTO to CNIPA, EPO and USPTO. Moreover, the top three patent offices gained more market share for 5G patent applications and patents compared to 3G technology.
[1] [2017] EWHC 2988 (Pat), Unwired Planet v Huawei. [2] Jiangsu-01-civil-232,233,234 [3] https://www.greyb.com/blog/how-greyb-performs-sep-essentiality-checks-in-a-cost-effective-way/ [4] Clarivate: Demystifying the 5G standard essential patent landscape with manual SEP: Phase 2, October 2021 [5] IPlytics 2020 : https://www.iplytics.com/wp-content/uploads/2020/02/5G-patent-study_TU-Berlin_IPlytics-2020.pdf [6] IPlytics 2021 : https://www.iplytics.com/wp-content/uploads/2021/11/IPlytics-November-2021-Who-leads-the-5G-patent-race.pdf. [7] IAM: https://www.iam-media.com/article/who-leading-the-5g-patent-race-1 [8] IAM: https://www.iam-media.com/article/race-the-top-the-key-contenders-in-the-iot-sep-space [9] GreyB: https://www.greyb.com/blog/5g-patents/ [10] Clarivate: Demystifying the 5G standard essential patent landscape: Phase 3, 2022 [11] USPTO 2022 : https://www.uspto.gov/sites/default/files/documents/USPTO-5G-PatentActivityReport-Feb2022.pdf [12] IPlytics 2021 : https://www.iplytics.com/de/report/2021-revue-sep-cases-europe-beyond/ [13]Dernis et. al.: https://www.oecd.org/sti/inno/21682515.pdf [14] IPlytics offers two different query options. The first query option allows filtering the SEPs by technology generation, which narrows down the SEPs by their technology generation, i.e. 5G, for the respective enterprise. [15] Demystifying the 5G standard essential patent landscape: Phase 3, 2022